Email marketing effectiveness statistics: ROI, benchmarks, & trends for 2026


Email is one of the oldest digital marketing channels, but it continues to generate significant ROI and remains widely used. The question isn’t whether email is still relevant, but which metrics prove its effectiveness in 2026.
Let’s take a look at the email marketing effectiveness statistics 2026 has ushered in to understand whether email is still a promotional channel that companies can rely on as they develop and implement their marketing strategies.
Top 10 email marketing statistics every business should know
We begin with the across-the-board statistics that characterize the sector today:
- The global email marketing market is projected to grow at a CAGR of more than 13%.
- Global email marketing revenue is expected to approach $18 billion in 2027.
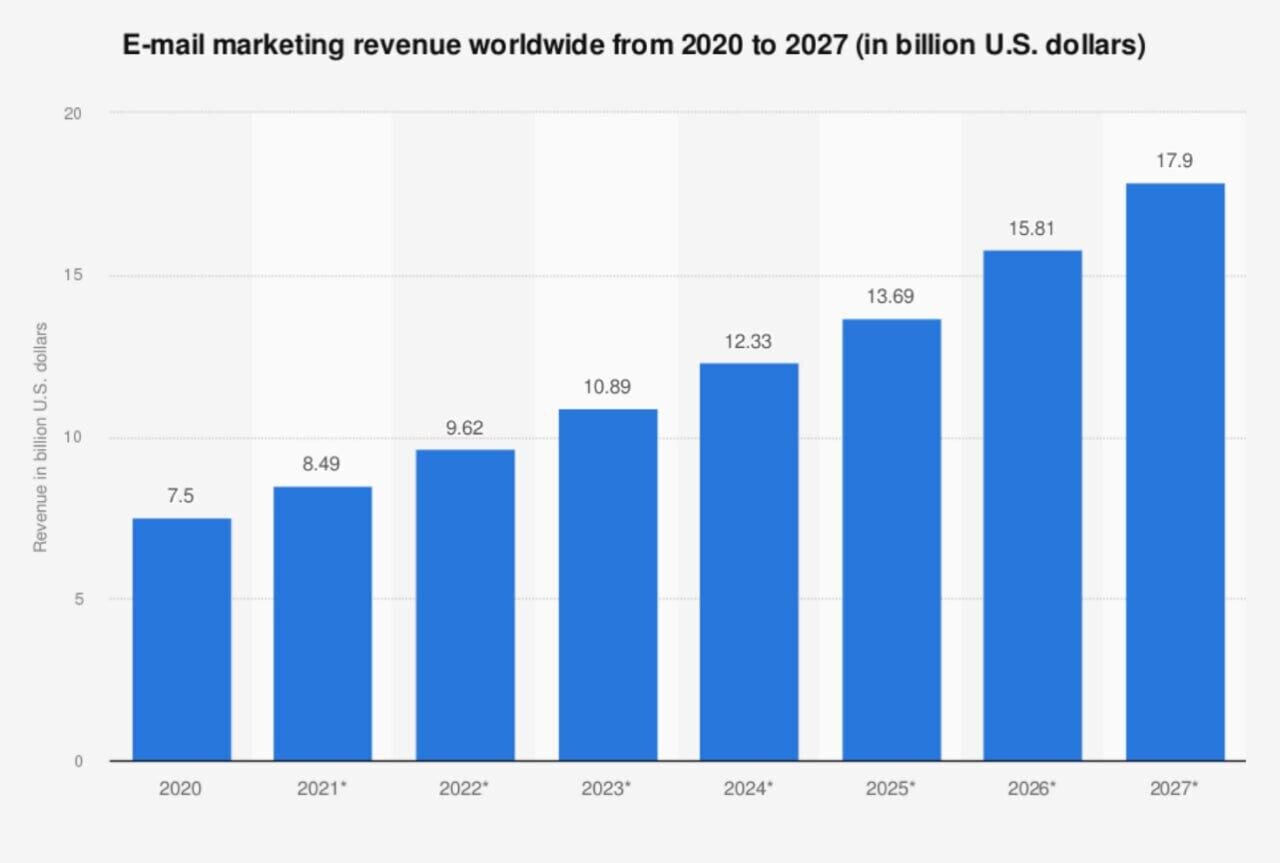
(Source: Statista) - Half of professionals in the field consider email marketing to be their most impactful marketing instrument.
- Email marketing has been reported to generate significantly more revenue from customer acquisition than several other digital channels.
- Increasing investment in email marketing is a priority for nearly 90% of marketers.
- Email is a staple of business strategy for 81% of organizations.
- In the B2B sphere, email is the most effective channel for contacting prospects for 73% of marketers.
- More than two-thirds of consumers (68%) prefer email as their primary channel for interacting with companies, and among B2B buyers, the percentage is even higher (77%).
- Sales representatives spend 21% of their working time writing emails.
- The average email response time is 1.5 hours.

Email marketing adoption and usage statistics
More insights into the importance of email today can be drawn from its widespread use.
Global email users
Despite the advent of new IT channels, the number of people using email is growing steadily. In 2025, there were 4.55 billion email users worldwide, and by 2028, this number is expected to reach 4.97 billion. Currently, around 392 billion emails are sent worldwide each day, with the USA leading in this metric.

(Source: Statista)
Email usage frequency
As statistics show, 75% of adults use email at least once a month. The average person today has 2-3 email accounts, 88% of which are checked at least once a day, while 39% are checked 3-5 times a day. With these figures in mind, 32% of marketers approach their clients with messages 2-3 times per month, while 19% send customers emails 4-6 times a month. Another 17% send emails at least once a month.
How to measure your own email marketing effectiveness
The effectiveness of email marketing statistics makes sense when you know how to gauge it.
The metrics that matter now
Email effectiveness is determined by its impact on revenue, engagement, and deliverability. The value that emails bring is measured by return on investment (ROI), revenue per email/recipient, and subscriber lifetime value (LTV).
Key engagement metrics to watch are open rate, click-through rate (CTR), click-to-open rate (CTOR), and conversion rate. Deliverability can be assessed by looking at inbox placement rate, bounce rate, and spam complaint rate. For most marketers, CTOR and conversions are the most crucial metrics.

(Source: Email Monday)
How to understand whether your emails do well
To get the most objective picture, you should not only compare your metrics against industry averages.

(Source: Mailchimp)
It is more important to benchmark against such figures alongside the results that your past campaigns yielded. In this way, you can learn what works in your unique situation and learn the peculiarities of your own subscriber base.
Email marketing ROI statistics
This is what most entrepreneurs value since they want to see how efficiently their money is working.
How email marketing ROI is calculated
To calculate email marketing ROI, subtract the total campaign cost from the revenue attributed to the campaign, divide the result by the total cost, and multiply by 100 to express the result as a percentage.
ROI = [(Total Revenue – Total Cost)/ Total Cost] X 100
ROI by industry and program type
Email ROI varies widely across verticals, with the index highest in eCommerce, retail, and consumer goods.

(Source: Email Monday)
In addition, email ROI may differ depending on whether we are talking about welcome sequences, promotional blasts, or newsletters. For instance, abandoned-cart workflows in the automotive and hardware and home domains generate the highest ROI ($9.86 and $9.63 per one dollar spent, respectively), whereas in the health and beauty sector, it is much lower ($2.65).
Email ROI vs. other marketing channels
By all accounts, email is considered the most effective marketing channel, surpassing social media, paid advertising, organic search, and others by a wide margin.

(Source: Email Monday)
Email engagement benchmarks: Open, click, and bounce rates
Engagement metrics help explain why campaigns generate the revenue and conversions they do. CTR and conversion rates are particularly useful for evaluating whether recipients act on your emails, while deliverability metrics help identify problems that can limit campaign performance.
-
Average open rate
Open-rate benchmarks vary considerably by industry, audience, email type, and measurement methodology. Historical benchmarks often fall in the 15-20% range, but these figures should be treated cautiously because Apple Mail Privacy Protection can inflate reported open rates.
Rather than treating a specific percentage as a universal target, compare your open rates with relevant industry benchmarks and, more importantly, with your own historical performance. Use CTR and conversion rate to assess whether recipients actually engage with and act on your emails.
-
Average click-through and click-to-open rates
Here, the average figures are much lower. The average CTR is between 2% and 3%, while the average CTOR across industries is somewhat higher, at 5.3%.
-
Bounce and unsubscribe rates
You should aim for the lowest possible rates. A healthy bounce rate is below 2%, with less than 1% being hard bounces. Try to keep your unsubscribe rate below the average threshold of 0.22%.

-
Benchmarks by industry
Naturally, the above numbers are averages across multiple verticals. When broken down by industry, the benchmarks can differ significantly, sometimes dramatically. Just look at these unsubscribe rate statistics.

(Source: MailerLite)
Discrepancies are also observed in other engagement metrics. For example, the retail email CTR (5.1%) is more than twice the B2C average. CTOR is highest in the manufacturing (14.82%) and legal (14.72%) industries, whereas it is approximately five times lower in the political (2.96%) and insurance (3.19%) industries.
Personalization and segmentation statistics
Segmentation and personalization can improve email relevance and, in turn, increase engagement and revenue.
The impact of segmentation on performance
When dividing your audience into groups, don’t limit yourself to basic demographic characteristics. Past behaviors (including purchase types, browsing history, average order value, CTRs, and open rates for previous messages) can be more indicative of a subscriber’s tastes, preferences, and pain points.
Some studies report revenue increases of up to 760% from more granular segmentation. However, this represents the maximum reported result rather than a typical uplift.

Personalization and revenue lift
Personalized emails have significantly higher open rates and reply rates.

(Source: Belkins)
Other engagement metrics can also improve when brands personalize email content. All of these translate into a remarkable ROI for personalized campaigns: 122% on average.

Dynamic content and its effect on engagement
According to Mailmend, 68% of marketers are confident that interactive elements and real-time email updates improve engagement metrics. These features keep recipients engaged 2.5 times longer and increase conversion rates by 120% for product recommendations and by 60% for abandoned-cart recovery.
of marketers say that interactive emails improve engagement.
Email automation statistics
Given the vast volume of emails to be sent every day, modern companies can’t do without email automation in their marketing campaigns.
Automated vs. batch-and-blast performance
Automation doesn’t mean adopting a one-size-fits-all approach. Batch-and-blast campaigns lead to low open rates, limited customer engagement, and high unsubscribe rates. In contrast, automated emails sent at the right time can increase email ROI by 30 times.
Cart-abandonment and welcome flows
Automating cart-abandonment flows is a highly cost-effective strategy, generating an ROI of 400% or more. Welcome-sequence automation also brings great results. Such emails display 80% open rates, 26% CTR, and 26.7% CTOR.

Drip and behavioral-trigger campaigns
Half of small and medium-sized organizations rely on marketing automation solutions for drip campaigns, which enables them to achieve 3 times higher CTR. Behavioral-trigger campaigns are an advantage in themselves because they demonstrate higher engagement outcomes (for instance, their open rate is 5.3% higher than generic ones). When automated, only 2% of such emails can generate up to 37% of email ROI.
Conversion and purchase-influence statistics
How instrumental are emails in guiding leads down the conversion funnel?
Conversion rates by industry
According to Swym’s benchmark, the average email conversion rate is around 31%, although the source’s definition of conversion and measurement methodology should be considered when comparing this figure with other benchmarks.

(Source: Swym)
How email influences buying decisions
According to Forbes Advisor, 59% of consumers admit that email marketing impacts their purchasing decisions. Research also indicates that 50.7% of people buy a product at least once a month after receiving a promotional email, and 23.8% make several email-prompted purchases a month.
of customers claim that email marketing affects their purchase.
Email marketing vs. other channels
The effectiveness of email can be evaluated by comparing it with other marketing channels.
Email vs. social media
Email marketing is three times more powerful than social media promotions and outperforms social media across major KPIs.

(Source: Peer based on OptinMonster data)
Email vs. paid search
Paid search campaigns can be relatively costly, generating only $2 in ROI per dollar spent, compared with the $36-42 ROI generated by email marketing.
Channel preference among marketers
Given the advantages that email marketing has over other channels, it is no wonder that 25% of professionals in the field name it their number-one tool.

(Source: Email Monday)
Mobile and device statistics
The ubiquity of portable tech has made marketers pay close attention to how their emails perform on mobile devices.
Share of email opens on mobile
Recipients open emails on desktops in only 39% of cases, while most opens occur on mobiles.

(Source: Forbes)
The cost of non-optimized emails
In view of such a high percentage of mobile opens (since 2020, mobile engagement has displayed 18% growth every year), not optimizing emails for mobile devices can significantly hurt engagement. Unfortunately, 44% of marketers never do so, although 72% of subscribers judge a brand by the usability of its mobile emails.
Neglecting the mobile experience of email users costs businesses a lot. When an email is not optimized for mobile devices, 42% of users never bother to open it and instead delete it upon receiving it.

Design implications for effectiveness
When designing emails for mobile devices, adapt them for dark mode, make CTAs prominent, leverage layout-level personalization, and follow accessibility compliance guidelines. Such emails receive 38% fewer spam complaints and generate 30% more first-link clicks.
Subject line and content statistics
These two aspects have an enormous impact on email effectiveness, since 43% of people decide whether to open an email based on its subject line.
Subject-line length and personalization
On average, an email subject line contains 44 characters, which is considered the optimal length for recipients.

(Source: AWeber)
Subject line personalization increases the chances of an email being opened by 26%, making this technique a first-rate effectiveness booster.
Visuals and GIFs
Imagery and motion immediately grab a recipient’s attention, helping marketers get their message across with fewer words and reach their goal faster. These content elements improve email performance by 72%.
Send time and frequency statistics
Knowing what to send is as important as knowing when to send.
Best days and times to send
An average recommendation is to send promotional messages between 10 AM and 2 PM, Tuesday through Thursday. However, sending time should be tailored to your audience’s demographics and preferences. For instance, B2C customers are more approachable on Friday afternoons and Saturdays, whereas Friday (as well as Monday) is a big no-no for B2B clients.
Frequency and unsubscribe drivers
People don’t like to be bombarded with emails, so receiving one email a week is acceptable to 61% of subscribers, while 28% also find receiving two or three emails acceptable. If brands become too intrusive and pushy with their promo offers, customers are likely to opt out of communication with them.

(Source: Zero Bounce)
AI in email marketing statistics
No contemporary industry can function effectively without involving artificial intelligence in its shop-floor routine, and email marketing is no exception.
AI adoption among marketers
A majority of companies are either using AI in their email marketing initiatives now or are planning to embrace it soon.

(Source: Forbes)
Such a high degree of adoption will enable organizations to rely on AI-driven tools in 89% of email workflows by the end of 2026.
Where AI lifts email performance
Businesses find AI-fueled software most useful for email personalization, retargeting, and subject line generation.

(Source: Forbes)
When used to create infographics, blog posts, emails, and other content, artificial intelligence helps improve their performance, according to 72% of marketers.
Deliverability and the open-rate problem (Apple Mail Privacy Protection)
Apple launched the Mail Privacy Protection protocol in 2021 as an ultimate email safety mechanism, but it had unexpected implications for email statistics.
What MPP changed
The system has radically transformed metric tracking for Apple users, who make up 46% of email clients. Before MPP, an email was considered opened only after the recipient actually opened it. MPP preloads images and tracks the pixels within them without the recipient opening the email, but still counts these emails as opened.
It distorts statistical reports across several parameters, such as send time, geo-targeting, and, most importantly, open rates. The latter can be inflated by 10-30%, meaning that reported numbers don't reflect actual open rates.

Which metrics still matter
Since open rates are no longer a reliable yardstick for email marketing effectiveness, you should measure your campaigns’ performance using other metrics, namely conversion rate, CTR, revenue per email/recipient, deliverability rate, unsubscribe rate, and customer LTV.
Wrapping up
Email is still highly effective, but marketers should stop evaluating it through open rates alone. ROI, conversions, revenue, deliverability, and subscriber value provide a much better picture. Personalization, automation, mobile optimization, and AI can improve performance when used strategically.
The effectiveness of these strategies also depends on how efficiently teams can design, test, personalize, and maintain their emails. Stripo helps marketers streamline that process with a no-code editor, reusable modules, collaboration features, and integrations with more than 90 ESPs.
FAQ
1. What is a good email open rate?
There is no universal “good” open rate. Compare your results with your industry and, more importantly, with your historical performance. Because Apple Mail Privacy Protection can inflate opens, CTR and conversion rate are more reliable indicators of engagement and business impact.
2. Is email marketing still effective in 2026?
Despite the advent of novel interaction channels, email remains the most effective tool for 41% of marketers, leaving social media (16%), paid ads (16%), and organic search (9%) far behind.
3. What is the ROI of email marketing?
On average, businesses receive $36-42 for each dollar they spend on email marketing. Exact figures vary by industry and email program type (welcome series, abandoned-cart messages, newsletters, etc.).
4. Which email marketing metric matters most?
The ultimate email effectiveness yardstick is the conversion rate because it shows the direct business outcomes of your campaigns. Other metrics you should pay attention to are click-through rate (CTR), click-to-open rate (CTOR), revenue per email/recipient, ROI, deliverability rate, spam complaint rate, and unsubscribe rate.
0 comments