Email infographics: Templates, specs, and how to build them right


Imagine you decide to make your email more visual and engaging by including an infographic from an annual report, so recipients can grasp the results at a glance. It’s a great idea, but if you simply export the graphic from the report as a single long PNG file, you could run into issues. When viewed on a mobile device, the image may become so small that it is unreadable. Also, recipients opening the email in Outlook might have image display blocked, leaving nothing but an empty frame where the graphic should be. And that’s just one potential scenario.
To help you avoid issues like these, we will show you how to match an email infographic to the type of email and when one image, HTML, or a hybrid works best, with templates you can adapt. You’ll also see which width, file weight, format, and Retina resolution keep the graphic readable on mobile, in dark mode, in Outlook, and with images off.
Key takeaways
- Infographics work best in emails where numbers carry the main message, such as reports, annual summaries, or product updates, and add little when the email makes one simple point.
- An image keeps a complex chart intact but disappears when images are blocked, while HTML stays visible and editable but handles only simple visuals, so many emails combine the two.
- On mobile, the infographic should stay readable without zooming, so a simple layout with fewer elements and large labels usually works better than a detailed graphic designed for desktop.
- For subscribers who use screen readers, alt text with the main figure or conclusion carries the message, and clear labels with strong contrast help readers with low vision or color blindness.
What is an email infographic?
An email infographic is a block of graphical data in an email, such as a chart, a row of key numbers with icons, a timeline, or a step-by-step diagram, that helps a subscriber grasp the message in a few seconds of scanning. Unlike a blog infographic that readers zoom into, an email version has to fit a content width of about 600 px, stay readable on mobile devices, and make sense in clients that block images. That’s why it usually covers a handful of data points and leaves the full report for a landing page.
Why use infographics in emails
When an email includes related numbers, a chart shows the relationship faster than a sentence. Compare “Open rates were 31% in January, 34% in February, 29% in March, and 38% in April” with four bars of different heights: the bars show the April jump at a glance, while the sentence makes the subscriber hold four numbers in memory.
A recap that shows subscribers their own results, such as orders placed, money saved, or lessons finished, gives them a reason to open the email and scroll to the end. For example, Grammarly uses this format in its weekly writing reports, which turn a subscriber’s activity into a short visual summary.

(Source: Email from Grammarly)
Throughout onboarding emails, icon-labeled steps tell a new subscriber what to do faster than a paragraph of instructions, and a progress bar shows how much setup remains.
For survey results and sector reports, an email marketing infographic with two or three findings gives subscribers a taste of the data and a clear reason to click through to the full version.
When infographics don’t work
An infographic adds file weight, design time, and rendering risk, so it pays off when the data needs a visual form.
Plain HTML text usually works better when:
- a message is one number or one date, like an order status or the end of a sale;
- an email has a single goal, such as a flash sale, where a dense visual competes with the CTA;
- subscribers need to copy, search, or translate the content, which text inside an image doesn’t allow;
- the data needs exact reading, as with price lists or contract terms.
Before you send, turn off images in the preview and read the email. If the subscriber still gets the key numbers and the next step, the infographic supports the message. But if the email shrinks to an empty frame and a button, you need to move the figures into HTML text (we’ll explain how to do that later in the article).
Types of email infographics and when to use each
The right type depends on the question your email answers for the subscriber: how much, how it changed, what to do next, or how far they’ve come.
This table matches each type with the email campaigns where it fits and the format that tends to render most steadily across email clients:
|
Type |
Use it for |
Format |
|
Key numbers |
Headline figures in welcome emails, impact reports, and recaps |
HTML text |
|
Bar chart |
Change over time in reports and newsletters |
Hybrid |
|
Progress bar |
Onboarding, loyalty points, fundraising goals |
HTML |
|
Steps or timeline |
Onboarding, order status, year-in-review |
HTML, stacked vertically |
|
Comparison |
Plan upgrades, before-and-after results |
HTML table |
|
Pie chart or map |
Survey shares, travel recaps, store locations |
Image with detailed alt text |
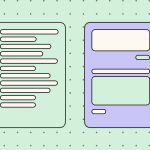
When picking one, you should consider not only the subscriber’s question, but also the phone screen space. A donut chart with eight segments may look tidy in a design file, but on a phone the slices and their labels become hard to tell apart. A horizontal bar chart with the same data stays readable because each label gets its own line.
Most emails are most effective with one main infographic type. For example, a year-in-review can combine key numbers with a small map of cities visited, but adding a timeline and a bar chart can make the email too long and reduce the main figure's prominence.

(Source: EmailLove)
For unique recaps, numbers inserted with merge tags stay as HTML text and change for each subscriber. A chart generated individually for each person requires a service that creates images when the email opens, adding setup work and another point where rendering can fail.
Email and newsletter infographic templates
An infographic email template gives you a tested layout for numbers, steps, or comparisons, so you can focus on the data and skip solving column stacking and image widths from scratch. When comparing options, look for templates where the key figures are editable text, and the layout collapses into one column on a phone, since these two details decide whether the infographic stays readable in most inboxes.
Examples that work
The formats below cover common email types where an infographic helps subscribers get the point faster:
1. Statistics and impact report
A donor or investor update often comes down to three or four large figures in the middle of the email, each with a short label and a few lines of context below. Since those figures carry the whole message, they belong in HTML text, where a subscriber who opens the email with images off still sees what the year achieved. Icons can stay as long as they remain small enough to leave the numbers in focus.

2. Product usage summary
SaaS companies send monthly or quarterly summaries that show account owners how they used the product. Metric cards in a grid suit this format: on desktop, subscribers compare values side by side; on a phone, the grid stacks into one column, with each card at a readable size.

3. Year in review
A year-in-review email pairs milestones with numbers, such as new programs launched, events held, or customers served. Separate color blocks for each figure keep the achievements apart without heavy images, which also helps the email load quickly.

4. Personal annual report
When the data belongs to the subscriber, such as workouts completed or orders placed, the email reads like a personal summary. Merge tags insert each person’s numbers as HTML text, and a closing section about next year’s goals gives the email a natural CTA.

5. Birthday stats
A birthday or anniversary email can turn a subscriber’s history with the brand into a short personal recap: trips taken, countries visited, or miles traveled since they joined. A few personal figures make the offer that follows feel earned, which suits travel brands and loyalty programs.

6. Annual financial report
Investment and banking clients expect a yearly overview of how their money performed. A short block with the portfolio value, the year’s return, and a simple growth chart answers that question at the top of the email, so that the full statement can stay behind a link.

Whichever format you choose, keep the key numbers and the CTA in HTML text, and add alt text that names the figures shown in each image. Each email infographic template you can see above opens in the Stripo editor, where you can swap the sample data for your own and check the mobile preview before export.
Image vs. HTML infographics: Which to choose
The choice between an image and HTML comes down to two questions:
- Will the numbers reach subscribers who never load images?
- How often will you change them?
A quarterly chart that goes out once can stay a PNG, while a recap with each subscriber’s own figures needs text that your email platform can fill in.
When a single image is enough
A single image works when the visual itself carries information that HTML struggles to draw, such as a map of store locations, an illustrated process, or a pie chart with labeled segments. It also suits one-off campaigns: a designer prepares the chart once for an annual announcement, and nobody has to update it next month.
For consumer lists, the risk of a blank frame is lower, since Apple Mail and Gmail display images by default and together account for nearly 90% of the total market share. Even then, the image needs alt text that states the main figures, and the email copy should repeat the one number that matters most, so a subscriber who scrolls fast or uses a screen reader still gets the point.

When to build it in HTML
HTML makes sense when numbers must reach every subscriber, including B2B readers in Outlook with images blocked and people who use screen readers. HTML content loads with the email and remains selectable, so subscribers can copy a figure or translate the copy.
It also saves time when data changes. A monthly report or a personalized recap with merge tags updates by swapping values in text, while an image version needs a designer to redraw the chart every time.
Simple shapes translate well into HTML: key number blocks, progress bars, step lists, comparison tables, and horizontal bar charts made from table cells whose widths match each value. These table-cell bars also display in Outlook for Windows, though that client ignores rounded corners, shadows, and background images, so the bars appear square and flat. If you design them square with solid colors from the start, they look consistent across email clients.
Here is an example of an HTML email infographic created in the Stripo editor. You can use a Stripo pre-built email template and then edit it in HTML.

Hybrid approach: Image plus live-text headline and CTA
In a hybrid layout, the chart stays an image, while the headline, the key figure, a line or two of context, and the CTA appear as HTML text around it. A subscriber in Outlook with images blocked still reads the main message and can click the button, and a subscriber who sees the image gets the visual on top of numbers they already know.
The approach depends on keeping text and image in separate blocks. Copy laid over a background image looks similar in a mockup. Still, Outlook for Windows has the same rendering limitations with background images, box shadows, and other modern CSS properties, so the headline can end up on an empty area. With the text inside its own block, the message no longer depends on the picture.
For recurring reports, a hybrid block saved as a module in Stripo maintains the same structure from issue to issue, so only the chart and figures change.

Email infographic size, format, and technical specs
The way an infographic looks in the inbox depends on a few decisions made at export. A chart that looks sharp in Figma may arrive blurry on a phone or stretch the layout in Outlook, usually because of the file's width, resolution, format, or weight. Below, we go through each of these settings and the values that work for email.
Width and dimensions
A chart sized for a standard 600 px email template looks fine in the design file, but on a phone it shrinks to fit a much narrower screen. Labels that seemed readable on desktop end up smaller than the surrounding body copy, and the subscriber has to zoom in to read the axis.
In multi-column layouts, the image must match the width of its column: a 600 px chart squeezed into a 280 px column becomes a thumbnail. Height leaves more freedom, but a tall graphic pushes the CTA far down the screen, which is why long infographics usually work better as several slices.
File size and weight
Image weight affects how quickly the infographic loads, especially on mobile data. Email clients don't publish an official image size limit, so the practical rule is to keep each file as light as the design allows.
A chart exported at 2x is the usual weak spot, since doubling the width and height means four times as many pixels. In the Stripo editor, Image Compression in the workspace settings automatically compresses uploaded images: PNG files are compressed without manual setup, and JPG files use one of three compression levels.

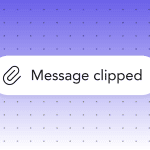
Gmail’s clipping limit works differently. When the HTML code of an email passes roughly 102 KB, Gmail hides the rest of the message behind a “[Message clipped]” link. The limit applies to the code itself, so images loaded from a server do not count toward it. An HTML infographic with many nested tables and inline styles can push an email over the limit, which is one more reason to keep coded charts simple.
PNG vs. JPG vs. GIF
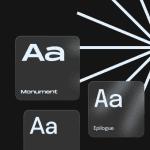
Each format compresses an image differently, so the same chart can look crisp in one format and smudged in another. This table matches each format with the kind of graphic it suits and the problem to watch for:
|
Format |
Best for |
Watch out for |
|
PNG |
Charts, icons, text, flat colors |
Heavy files if the graphic includes photos |
|
JPG |
Photos inside an infographic |
Blurry artifacts around text and thin lines |
|
GIF |
Simple animation, such as growing bars |
Only the first frame shows if animations are off in Windows |
PNG suits most infographics because it keeps text, lines, and solid colors sharp, while JPG tends to blur them. GIF works for simple animation, but if a recipient turns off animations in Windows, Outlook shows only the first frame, so the key figure belongs there. Avoid SVG charts, since Outlook on the web and the new Outlook for Windows no longer display inline SVG images and instead show a blank space.
Retina (2x) images
Smartphones and modern laptops have high-density screens that use two or more physical pixels for every CSS pixel. On such a screen, a 600 px image shown at 600 px looks slightly blurry, and small labels suffer first. To keep the chart sharp, export it at twice the display size (1200 px for a 600 px slot) and let the HTML scale it down.
Two settings control the display size: the width attribute in the image tag (width="600") and a max-width rule in its CSS. Outlook for Windows doesn't always respect just one, so using both keeps a 1200 px file from stretching the email.
A 2x file weighs more than a regular one, so it needs compression, but gentle compression, because heavy compression blurs small text initially.
Slicing long infographics
A tall infographic exported as one file loads as a single large download and gets only one alt text and one link for all of its content. Slicing it into several images, stacked in one column, lets each part load on its own and carry its own description and link.
The cuts work best between sections, along empty background areas, so no line of text or chart bar crosses the seam. A slice that splits a label can shift by a pixel in some clients and leave a visible line through the text. Thin white lines between slices usually come from the default inline spacing of images, which display: block in the image style removes.
If the infographic still runs several phone screens after slicing, the email can carry the main section and link to the full version on a landing page.
How to make email infographics mobile-friendly
On a phone, an email infographic shrinks to fit the screen, often to about 60% of the 600 px it was designed for. Whether the chart still reads well at that size depends mostly on two decisions made before export: the layout and the text size within the image. A test on a real phone then shows whether those decisions worked.

Single-column layout
A three-column row of stat cards looks balanced at 600 px, but on a phone each card gets about a third of an already narrow screen, and the numbers become too small to read. Designing the infographic as a single column from the start avoids this: each block retains the full width of the screen, and the reading order stays the same on desktop and mobile.

Two columns can still work for a simple comparison, such as before and after, as long as each side holds one short value that fits on a small screen.
Minimum font size inside the graphic
Text inside an image scales down together with the image, so a label that looks fine in the design file can end up tiny on a phone. Apple’s design guidance says text should be at least 11 points so it’s legible at a typical viewing distance without zooming. That number describes the size a person sees on the screen, so the label in your file needs to be larger. Both numbers describe the size a person sees on the screen, so the label in your file needs to be larger.
For example, a 600 px infographic shown on a phone screen about 375 px wide shrinks to roughly 62% of its size. A label that should appear at 11 px on that screen needs to be about 18 px in the 600 px design, or 36 px in the 2x export. Axis labels and footnotes usually fall below this line first, so they are the first candidates to move out of the image and into HTML text under the chart.
Stacking vs. scaling
On a narrow screen, a single image can only scale, shrinking everything proportionally, while separate blocks placed side by side can stack, moving under each other so each stays readable. A row of three stat cards coded in HTML or exported as three images can turn into a column on a phone, whereas one wide image of the same row just gets smaller.
Stacking usually relies on media queries, and Can I email marks their support as partially supported in Gmail, Outlook, and Yahoo!, so the stacked version deserves a check in the Gmail app before sending.
In the Stripo editor, structure settings let you control how containers stack on mobile, and the Responsive image option fits an image to the screen width, so you can set both behaviors without code.
For desktop:

For mobile:

Testing on real devices
A design tool preview shows the layout at a phone’s width, and each mail app adds its own behavior on top: Gmail on Android, Apple Mail on iOS, and Outlook treat images, fonts, and dark mode slightly differently. A test send to one iPhone and one Android phone shows what the subscriber will see, including whether labels stay readable without zooming and whether stacked blocks keep their order.
Testing every client on real phones takes more devices than most marketers have on hand. Stripo's email client testing, powered by Email on Acid, shows screenshots of the email across clients and devices from the editor, and a couple of real phones confirm details screenshots can miss.

Dark mode, image blocking, and Outlook: Rendering pitfalls
An infographic that passes every check in a light-mode preview can still break after sending, because subscribers open it in dark mode, with images turned off, or in Outlook. Each of these cases has a fix that takes a few minutes before export.
Dark mode
When a subscriber reads in dark mode, the mail app may leave the email as designed, darken only light backgrounds, or invert colors across the whole message, and the sender has little control over which one happens. Custom dark styles rely on the prefers-color-scheme media query, and Can I email reports that it’s supported in Apple Mail, partially supported in Outlook, and not supported in Gmail.
For an infographic, the most common issue is a transparent PNG with dark labels: once the background turns dark, the labels disappear into it. A chart exported with its own solid light background and a thin light border keeps the labels readable, because the image carries that background into dark mode. HTML numbers and bars behave differently, since the app recolors them, so a brand color that worked on white may lose contrast against a dark background.
In Stripo, dark mode theme emulation roughly shows how the email will look in dark mode, and custom dark mode lets you swap a chart image for a version optimized for dark backgrounds.

Image blocking
Microsoft’s documentation confirms that classic Outlook is configured by default to block automatic picture downloads from the Internet, so some subscribers will see the infographic area before the chart. What appears in that area depends on the HTML around the image.
With width and height attributes on the image tag, the empty frame maintains the chart's size, and the CTA below stays where subscribers expect it. A background color on the cell behind the image, together with alt text that names the key figures, turns the frame into a short text version of the chart.
Outlook
Classic Outlook for Windows renders email with Microsoft Word’s engine, so a coded infographic can look different there. Large numbers set in a web font may fall back to Times New Roman unless the font stack lists a system font such as Arial after the brand font, and that fallback can push a number onto a second line. Images can also appear larger than intended when Windows display scaling is set above 100%, so give every image an explicit width attribute.
Accessible email infographics
A chart carries most of its meaning visually, so a subscriber who uses a screen reader, has low vision, or struggles to tell some colors apart can miss the email's point. The fixes below make the same information available through text and contrast, and they also help anyone who opens the email with images off.
Writing alt text for data-heavy images
Alt text for a chart works best when it states the finding the chart shows. “Bar chart” tells a screen reader user only that a picture exists, while “Bar chart: newsletter signups grew from 1,200 in January to 2,100 in April” gives them the same takeaway a sighted reader gets. The W3C’s image tutorial recommends putting the most important information at the beginning and skipping words like “image” or “picture”, since screen readers already announce that an image is present.
The same tutorial sets a limit: if more than a short phrase or sentence is needed, it would be better to use one of the long-description methods discussed for complex images. For most infographics, this means one sentence of alt text with the main figure, plus a fuller description in the email body.
Stripo’s Accessibility Checker flags images that have no alt text, and its AI option drafts a description you can edit. For a chart, that draft is a starting point, and the actual figures still need to be entered by hand.

Text summaries and long descriptions
According to the W3C, graphs, charts, and maps require two types of text alternatives: a short description in the alt attribute and a long description that includes the essential information. In email, the most reliable place for that long description is the email body itself, right next to the chart. The W3C suggests the same approach for web content and notes that visible descriptions reach more people: make long descriptions available to everyone to broaden the audience.
A summary of two or three sentences under the chart usually covers what a subscriber needs: the main trend, the highest and lowest values, and what changed. When the data matters in detail, such as quarterly results in an investor update, a small HTML table with the same numbers gives screen reader users something they can move through cell by cell. For a longer report, a link to the full data on a web page keeps the email short.

Color contrast and color-blind-safe palettes
Text inside an infographic follows the same contrast rules as regular text, with a ratio of at least 4.5:1 against its background under WCAG. Bars, lines, and pie segments have their own requirement: WCAG 2.2 asks that parts of graphics required to understand the content reach a contrast ratio of at least 3:1 against adjacent colors, and the W3C notes that each item within such an infographic should be treated as a set of graphical objects, regardless of whether it is in one file or separate files.
Adjacent segments in a pie chart or stacked bar often fail this check against each other. The W3C’s technique is simple: if adjoining colors have less than a 3:1 color-contrast ratio, add a border to each color with at least a 3:1 color contrast.
Color alone also shouldn’t carry the data. EU accessibility guidance states that content must not require end users to distinguish between colors, so a red-and-green pair that marks growth and decline needs a second signal, such as direct labels on the bars, arrows, or different line patterns. Stripo’s Accessibility Checker flags low-contrast HTML text and suggests compliant colors with Auto-tune. Colors inside a chart image need a separate check with a contrast tool before export.

WCAG and EAA requirements
For infographics, there are such WCAG 2.2 criteria:
- 1.1.1 Non-text Content: Every chart has a text alternative;
- 1.4.1 Use of Color: Color is not the only way to tell data apart;
- 1.4.3 Contrast (Minimum): Text, including text inside images, reaches a 4.5:1 contrast ratio;
- 1.4.11 Non-text Contrast: Bars, lines, and segments reach 3:1.
Brands that sell to EU consumers in sectors such as eCommerce or banking also fall under the European Accessibility Act. The act doesn’t mention marketing emails by name, so whether your specific email falls under it depends on the service it belongs to and on national law.
How to create an email infographic step by step
You can prevent most of the problems above by settling the data, format, and HTML before anyone opens a design tool. The steps below follow that order, from the main message to the final test.
1. Pick one message and a few numbers
Before any design work, write down the single sentence the infographic should prove, for example, “Support replies got twice as fast this quarter.” Figures that don’t support that sentence can move to a linked report, which usually leaves a handful of numbers for the email itself.
2. Choose the type and the format
With the message settled, the type follows from what the numbers do: a change over time points to a bar chart, progress toward a goal points to a progress bar, and a sequence points to steps. The format depends on who reads the email. For a B2B list with many Outlook readers, HTML or a hybrid layout keeps the key figures visible when Outlook blocks images.
3. Design the chart
Only the visual part of the infographic needs a design tool. Headlines, key numbers, and the CTA go into the email as HTML text, so the graphic can stay focused on the chart.
4. Export for email
The chart goes out as a PNG at twice its display width, with labels large enough to read on a phone. A last look at the file at phone width helps catch any label that ended up too small, and the size and format guidelines from earlier in the article cover the rest.
5. Assemble the infographic block
In the email, the block usually follows the hybrid pattern: a headline and the key figure in HTML text, the chart image below them, and a button at the end, all in a single-column structure. For a recurring report, recreating this block each month takes time and results in small inconsistencies across issues. In the Stripo editor, you can save the finished structure as a module, so the next issue starts from the same layout, and only the chart and numbers change.

6. Add alt text and a short summary
Alt text gets one sentence with the main finding, and two or three sentences of HTML text under the chart carry the rest of the data. Writing both now, while the numbers are fresh, takes less time than adding them after the email is approved.
7. Test before sending
A test send to a real phone, a look at the email in Outlook, and a check in dark mode show whether the earlier steps held up. If one of them reveals an empty frame or unreadable labels, the fix usually goes back to step 2 or step 4.
Tools to design the graphic
The right tool depends on how much control you need over the chart and how often you update it.
Here is how common options compare for email infographics:
- Figma: Full control over layout and brand styles, though charts need to be drawn by hand or with plugins;
- Canva: Ready-made chart and infographic elements, with label sizes worth checking before export;
- Google Sheets or Excel: Quick charts straight from the data, once the default styling gets brand colors and larger labels;
- Datawrapper: Clean charts and maps from a spreadsheet, exported as a static image for email;
- Stripo: Ready-made infographic templates for email, drag-n-drop blocks and utility widgets that create simple visuals right in the email without a separate export.
Whichever tool you pick, the file that goes into the email is the same: a static PNG at twice the display width. Interactive charts from these tools fit better on a landing page, and the email can link to the full version there.
Where infographics fit in your email program
Infographics help in some email campaigns and get in the way in others. Here’s where they usually work and what to show in each case.
Welcome and onboarding
A welcome email that shows the next steps as a short visual sequence gives new subscribers something to act on right away. Three numbered stages, each with an icon, such as completing a profile, choosing preferences, and making a first purchase, fit on one phone screen and work well as HTML blocks that stack on mobile.
Later in the onboarding series, a progress bar can show how much of the setup is complete, which turns a string of emails into a path with a visible end.

(Source: Email from Zoom)
Product updates and comparisons
When a release changes something subscribers already use, a before-and-after view explains it faster than a changelog: two columns showing the old and new values, such as export time or the number of steps in a flow. For plan upgrades, a side-by-side feature comparison works better as an HTML table, since subscribers often want to copy a price or check a detail.

(Source: Email from ProWritingAid)
Year-in-review and personalized recaps
In a year-end recap, subscribers look for their own numbers first. The infographic works best when every figure is personal and paired with a short label that explains it, for example, “42 workouts, your best year so far.” Merge tags keep these figures as HTML text, so they stay readable when images are blocked.
Brands without per-subscriber data can send a company-level recap with a few milestones, as long as it ends with something the subscriber can do next.

(Source: Stripo template)
Survey and report results
People who took a survey already care about the outcome, which makes the results email a natural place for a chart. Two or three findings in a short visual block, with the full report on a landing page, keep the email brief and give subscribers a reason to click.
A poll from a previous email works the same way as a follow-up: subscribers see how their answer compares with everyone else’s.

(Source: Email from Bedgear)
Newsletters
In a newsletter, an infographic usually competes with several other blocks for attention. A single number of the week or a small chart near the top gives readers a reason to keep scrolling, while a full-width infographic in the middle can push the rest of the content far down the screen on mobile.

(Source: EmailLove)
Promotions
Promotional emails leave the least room for infographics, because the offer and the button carry the message. A visual still helps when the promotion depends on numbers, such as tiered discounts or savings over a year, where a simple bar or a row of key figures makes the math clear at a glance. For a single discount code or a flash sale, a large HTML headline usually works better than any chart.

(Source: Email from Puma)
How to measure the impact of email infographics
Open rates say little about an infographic, partly because Apple’s Mail Privacy Protection hides from senders whether a subscriber has opened their email, so open data for subscribers who use Apple Mail tells you little. Clicks give a clearer picture, since a subscriber who clicks has looked at the email and decided to act.
For infographic email marketing, three metrics are usually enough to judge the result:
- clicks on the infographic itself, when the chart links to a full report or landing page;
- click-to-open rate for the whole email, compared with similar emails sent without a visual;
- conversions on the page the email leads to, such as report downloads or plan upgrades.
An A/B test is the clearest way to check whether the infographic brings more clicks than the same content in plain text. You send the same email to two random halves of a segment: one version includes the infographic; the other presents the same numbers in text.
Keep the subject line, send time, and CTA identical, so any difference in clicks points to the visual. One test can be misleading, and repeating it across two or three sends yields a steadier result.
To see which part of the email gets the clicks, the chart and the CTA need separate links that analytics can distinguish, usually via a different utm_content value on each. In Stripo, UTM parameters set in Message Settings apply to every link in the email, and a unique parameter for a single link, such as the chart, can be set in that link’s own settings.
If the infographic version wins on clicks but loses on conversions, the visual probably draws attention without making the next step clear. In that case, the fix usually lies in the CTA and the summary text around the chart, and the chart itself can stay as it is.
Wrapping up
An infographic can make your email easier to scan, but only if subscribers can read it on a phone, in dark mode, in Outlook, and with images off.
Before you send your next one, run through a quick check:
- the format suits the content (an image for a detailed chart, HTML for key numbers and simple bars, or a hybrid when you need both);
- the image is exported at 2x, displayed at 600 px or less, and compressed;
- labels stay legible on a phone screen, and colors keep enough contrast on a dark background;
- the main figure appears in alt text and in a line of HTML text next to the visual;
- the chart and the CTA have separate links, so you can see which one gets the clicks.
Start with one campaign where the numbers matter most to your subscribers, such as a monthly summary or a product update, and send a text-only version to part of the segment. If the infographic version brings more clicks and conversions, you can reuse the format in other emails with more confidence.
FAQ
1. Are infographics still relevant in 2026?
Yes. Subscribers often skim emails on a phone, and a clear chart lets them see a trend or result in a few seconds, which takes longer to find in a paragraph of numbers. Personal usage stats and progress updates are good examples, because the chart shows each subscriber their own data.
2. What size should an email infographic be?
600 px wide in the email, with the image file itself 1200 px wide, so it stays sharp on Retina screens. The height has no fixed limit, but splitting a very long graphic into several images makes it easier to load and read, and a smaller file size helps it appear faster.
3. Can you put an infographic in an email body?
Yes. You can add it as an image with alt text, recreate simple charts in HTML, or combine both. An attachment isn’t necessary, and subscribers are less likely to open one.
4. Do image-heavy emails hurt deliverability?
Images alone rarely cause problems, but an email that is one large image with almost no text gives spam filters and subscribers little to work with. Keep the key message, the main figure, and the CTA in HTML text.
5. Should an email infographic be a GIF?
Usually no. A static PNG or JPG is lighter and shows the same way everywhere. If you use a GIF for simple motion, put the key figure on the first frame, since some Outlook versions on Windows show only that frame.
6. How do I add an infographic to Gmail or Outlook emails?
For a personal email, insert the image into the message body. In Gmail, use Insert photo and choose Inline. In Outlook, go to Insert, then Pictures. For a campaign, design the email in an email builder and send it through your ESP so it looks consistent across clients.
7. What is the best free tool to make an email infographic?
The best tool depends on the type of infographic. Canva’s free plan has infographic templates and works well for designed visuals with icons and text. For a chart based on your own data, Google Sheets and Datawrapper are free options that let you export a clean chart as an image.
0 comments